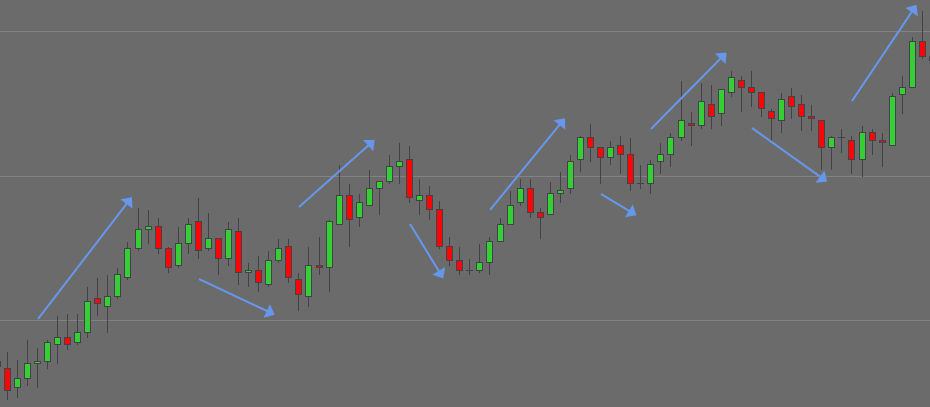
A trend is determined by a sequence of higher highs and higher lows, in the case of an uptrend, and a sequence of lower highs and lower lows, in the case of a downtrend.
Example of uptrend:
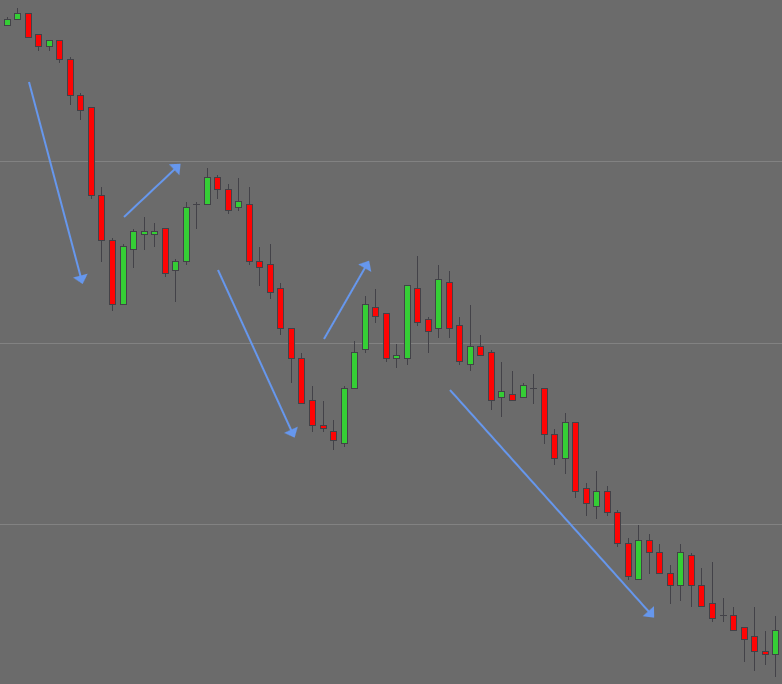
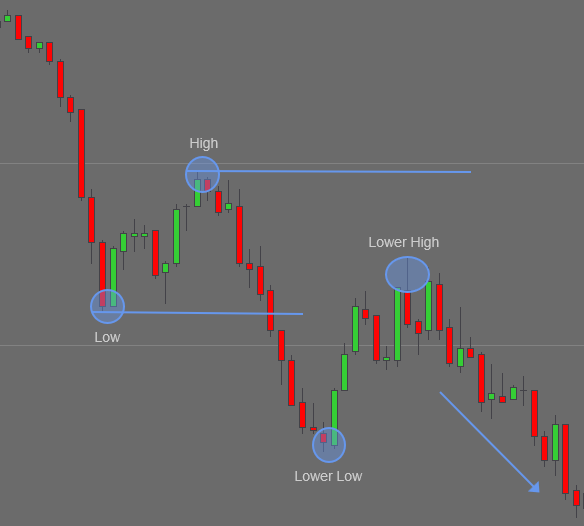
Example of downtrend:
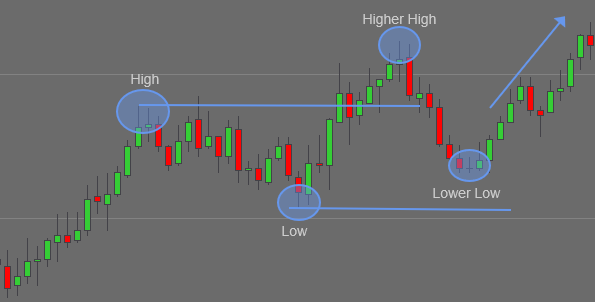
For an uptrend, the trend is broken once the price breaks back down below a previous low after failing to make a new higher high.
For a downtrend, the trend is broken once the price breaks back above below a previous high after failing to make a new lower low.
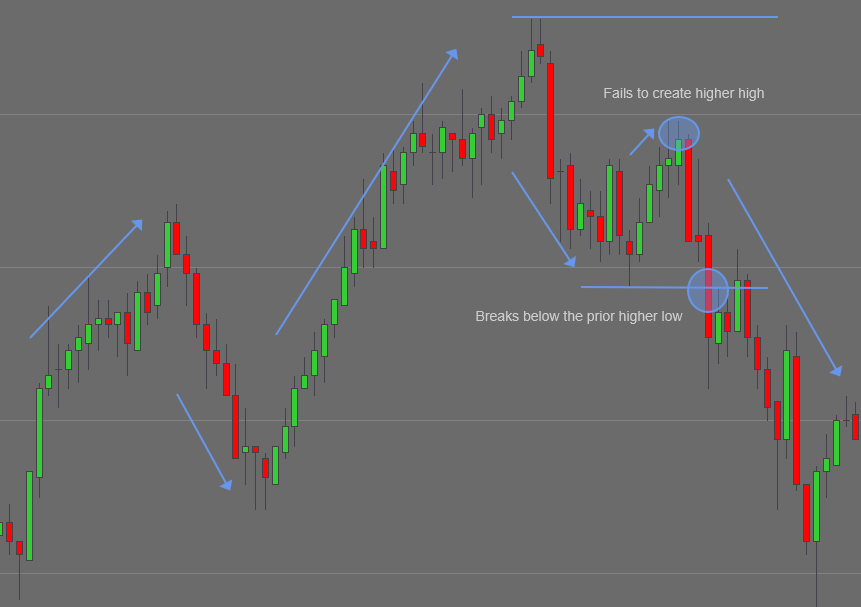
Example of uptrend failing:
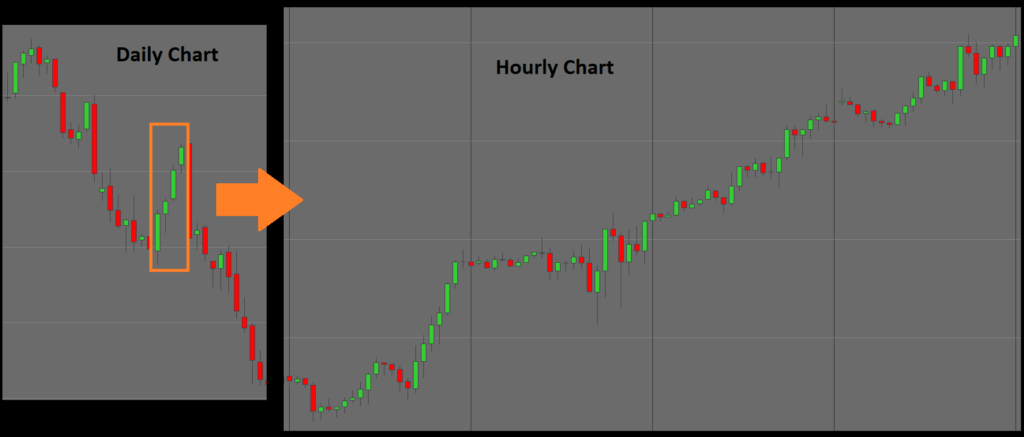
Trends can occur on different scopes and timeframes. It can be helpful to look at multiple timeframes when identifying trends. A price can be moving in a clear uptrend on a smaller timeframe, but that may be part of a stronger downtrend on a larger timeframe.
Example of a short term uptrend occurring within a long term downtrend: